

How to Use Moving Averages for Profitable Swing Trades
Learn how to use moving averages for profitable swing trading. Discover SMA/EMA crossover strategies to find the best stocks to buy today in India.
In the fast-paced world of the Indian stock market, swing trading has become a favorite strategy for traders who want short- to medium-term profits.
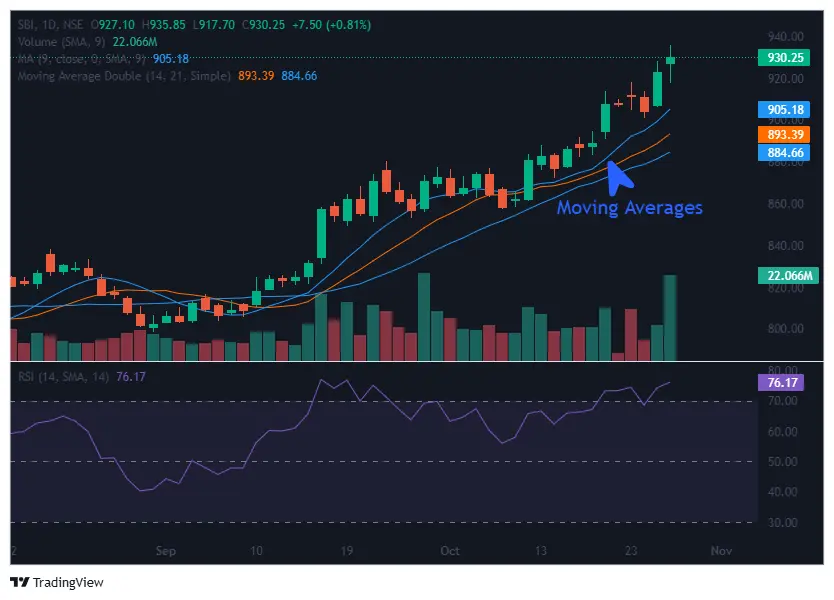
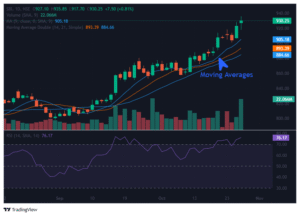
One of the most reliable tools for mastering swing trading strategies is the moving average indicator — a simple yet powerful way to identify trends, reversals, and trade entry or exit points.
This guide will help you learn how to trade stocks effectively using Simple Moving Average (SMA) and Exponential Moving Average (EMA) to find the best stocks to buy today and build confidence as a swing trader.
What Are Moving Averages in Trading?
A moving average (MA) is a trend-following technical indicator that smooths out price data by creating a constantly updated average price.
It helps traders filter out short-term noise and focus on the underlying trend.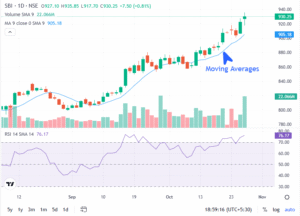

Types of Moving Averages
-
- Simple Moving Average (SMA):
Calculates the average price over a set period (e.g., 20-day or 50-day SMA).
It’s ideal for identifying long-term trends and dynamic support/resistance levels.
- Simple Moving Average (SMA):
-
- Exponential Moving Average (EMA):
Gives more weight to recent prices, making it more responsive to market movements.
It’s often used by swing traders to spot trend reversals early.
- Exponential Moving Average (EMA):
Why Moving Averages Matter in Swing Trading
Swing trading relies heavily on identifying short- and medium-term price trends.
Moving averages act as a visual guide, helping traders understand whether the stock is trending up, down, or sideways.
Benefits of Using Moving Averages
-
- Identify trend direction easily.
-
- Spot potential reversals through crossovers.
-
- Recognize dynamic support and resistance levels.
-
- Help confirm entry and exit points in swing trading stocks.
-
- Combine well with indicators like RSI and MACD.
How to Trade Using SMA and EMA Crossovers
The SMA/EMA crossover strategy is one of the most popular methods among professional swing traders.
1. The Golden Cross (Bullish Signal)
When a short-term moving average (e.g., 20 EMA) crosses above a long-term moving average (e.g., 50 SMA), it signals a potential uptrend.
Traders often consider this a buy signal.
Example:
If the 20 EMA crosses above the 50 SMA in a stock like Tata Motors, it suggests increasing momentum and potential for short-term gains — a sign of one of the best stocks to buy today.
2. The Death Cross (Bearish Signal)
When the short-term moving average crosses below the long-term moving average, it indicates a possible downtrend or reversal — a sell signal for swing traders.
3. Using Moving Averages as Dynamic Support & Resistance
Moving averages can act as dynamic support (in an uptrend) or resistance (in a downtrend).
-
- When price touches the 50 EMA during an uptrend and bounces higher — it’s a buy zone.
-
- When price hits the 50 EMA in a downtrend and reverses lower — it’s a sell or shorting opportunity.
Practical Moving Average Setup for Indian Swing Traders
Here’s a simple yet powerful moving average setup ideal for Indian markets:
| Indicator | Timeframe | Purpose |
|---|---|---|
| 20 EMA | Short-term | Entry signal |
| 50 SMA | Medium-term | Trend confirmation |
| 200 SMA | Long-term | Market direction |
Steps to Follow:
-
- Identify the trend using the 50 SMA and 200 SMA.
-
- Wait for 20 EMA crossovers for entry signals.
-
- Confirm with RSI (above 50 = bullish) and volume spikes.
-
- Use trailing stop-loss near moving averages to protect profits.
Example: Swing Trading with Moving Averages
Let’s consider Infosys Ltd (NSE: INFY):
-
- The stock trades above the 50 SMA and 200 SMA (uptrend confirmed).
-
- The 20 EMA crosses above the 50 SMA (bullish crossover).
-
- RSI is at 60, and volume spikes — confirming momentum.
Entry: Buy near ₹1,750
Stop-Loss: Below ₹1,720
Target: ₹1,850–₹1,880
- RSI is at 60, and volume spikes — confirming momentum.
This approach allows traders to capture short-term price swings safely while minimizing risk.
Common Mistakes to Avoid with Moving Averages
1. Trading Every Crossover
Not all crossovers are reliable. Wait for volume confirmation and trend direction before entering.
2. Ignoring Market Volatility
During sideways or volatile markets, moving averages can generate false signals.
3. Not Using Stop-Loss
Even with accurate indicators, always protect capital with stop-loss orders.
Advanced Swing Trading Strategies Using Moving Averages
Combine moving averages with these tools to enhance your edge:
-
- RSI + EMA: For confirming trend strength.
-
- MACD + SMA: For early reversal identification.
-
- Candlestick Patterns + Moving Averages: For precise entries (Doji, Hammer, Engulfing).
-
- Multi-Timeframe Analysis: Use the daily chart for trend and 1-hour chart for entries.
Final Thoughts
For Indian traders looking to learn how to trade stocks effectively, moving averages provide a simple yet powerful framework.
They help identify swing trading opportunities, highlight trend direction, and build discipline through clear entry and exit rules.
By combining moving averages with tools like RSI, MACD, and candlestick analysis, you can create a winning swing trading strategy that balances profit potential and risk control.
Stay patient, trade with logic — and let the moving average indicator guide you toward smarter trading decisions.
Frequently Asked Questions (Q&A)
The 20 EMA and 50 SMA combination works best for short- to medium-term swing trades. They provide timely signals without too much lag.
Start with one or two moving averages (like 20 EMA and 50 SMA), trade on daily charts, and confirm with RSI or candlestick patterns before entering trades.
Yes! When stocks show bullish crossovers with strong volume and RSI confirmation, they often indicate the best stocks to buy today for swing trading.
Moving averages work best in trending markets. Combine them with support/resistance zones and risk management to reduce false signals.