By NexGen Trade | Your Resource for Astute Indian Equity Share Investing
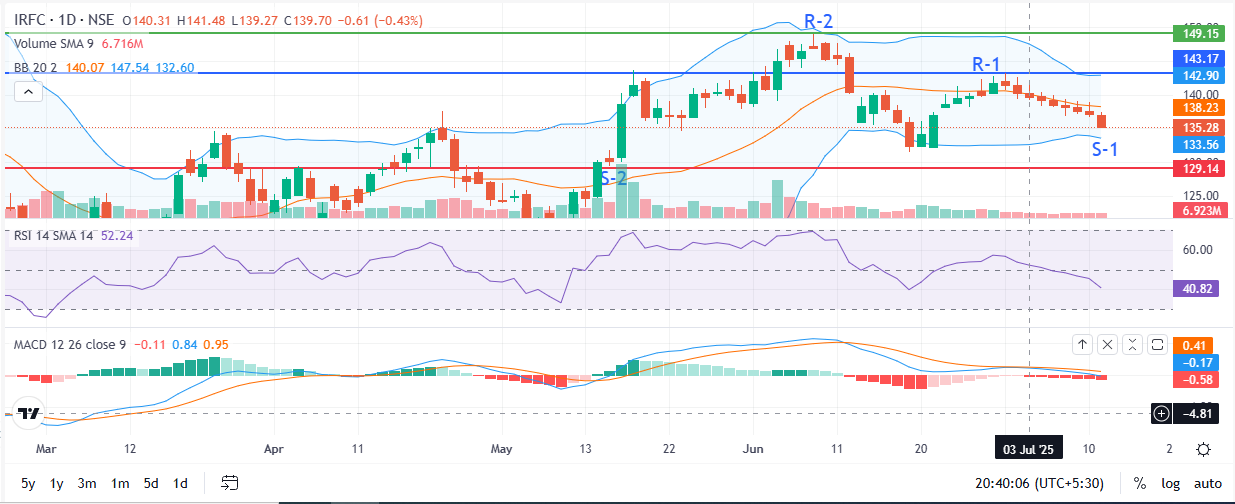
On technical charts, Indian Railway Finance Corporation (IRFC), a well-known public sector organization in the finance industry, is displaying indications of weakness. The stock is currently trading around a crucial support level at ₹132 after dropping from its most recent high of ₹143.15. Both technical and fundamental insights are crucial for well-informed decisions as investors seek clarity in a chaotic market.
Let’s examine IRFC’s current position and the factors that investors should think about before acting in the Indian equity market.
Overview of the Company: What Is IRFC?
Indian Railways has a specialized finance division called IRFC. It was founded in 1986 and is an important source of funding for the development and upgrading of India’s railway network. Its main activities include project funding, rolling stock financing, and leasing. An essential part of many portfolios aimed at the public sector, IRFC is a government-backed NBFC (Non-Banking Financial Company) with a solid credit profile and comparatively steady long-term fundamentals.
Since its 2021 listing on Indian stock exchanges, the corporation has drawn interest from institutional and ordinary investors seeking stable returns through public sector undertakings (PSUs).
📉 A snapshot of prices as of today
Open: ₹137.00
High: ₹137.30
Low: ₹135.14
Close: ₹135.14
Recent High: ₹143.15
Previous Low/Support: ₹132.05
Candle Pattern: Bearish Marubozu
With no intraday recovery, the bearish Marubozu candle—a powerful red candle without wicks—indicates obvious selling pressure. Unless there is a significant reversal, this usually means that the decline will continue.
Breakdown of Technical Indicators
✅ 1. The relative strength index, or RSI, is 40.50.
Weakening momentum without going oversold is indicated by an RSI close to 40. Although the indication does not now point to a strong buying zone, it might do so soon if the price falls to ₹132 or lower.
✅ 2. The Moving Average Convergence Divergence, or MACD.
The MACD line has crossed below the signal line, indicating a bearish crossover. Usually, this signals the beginning of negative momentum, especially if volume and price movement support it.
✅ 3. Moving Average
The price has fallen below its Simple Moving Average (SMA), indicating short-term negative sentiment. For investors in momentum, this is a warning sign.
✅ 4. Bollinger Bands:
Upper Band: ₹142.91
SMA (Middle Band): ₹138.22
Lower Band: 133.54 naira
The fact that IRFC is currently trading slightly above the lower Bollinger Band indicates that a significant technical support zone is about to be reached by the stock. If it holds, we might see a brief stabilization or reversal, but a fall below this level could hasten the decline.
🛑 Levels of Support and Resistance
Instant Support (Bollinger lower band): ₹133.54
Key Support: the previous low of ₹132.05
Bollinger median (₹138.22) and the current high (₹143.15) are the resistance zones.
A close over ₹138.50 may indicate a brief recovery, while a break below ₹132 may cause a decline towards ₹128.
🔍 Investment Prospects: Purchase, Sell, or Hold Off?
📌 Traders on the short term:
This is not the best time to enter because of the bearish candle pattern, weak RSI, and MACD crossover. If the ₹132 support fails, there is a considerable chance of a breakdown.
It is advised to wait.
Before reentering, watch for reversal signals, such as a MACD crossover, RSI rebound, or bullish engulfing candle.
📌 Long-Term Investors:
Given its government support, steady leasing income, and infrastructure finance role, IRFC’s fundamentals are still sound. Although they should be prepared for some short-term volatility, long-term holders may want to think about accumulating in a phased fashion around ₹130–₹132.
💬 Professional Analysis on NexGen Trade
In the long run, IRFC is still a low-risk equity share because it is a component of India’s strategic finance and infrastructure objective. Technical indicators, however, are currently biased against new purchases. Before entering a trade, we suggest investors wait for either a breakout over ₹138 or a solid confirmation of support at ₹132.
The current correction does not necessarily represent the financial soundness of IRFC; rather, it is a component of the larger PSU profit-booking. Disciplined investors in the financial industry would want to keep an eye on things instead of jumping in right now.
Important Takeaways
At ₹132.05, IRFC is close to key support.
Weakness in the MACD and RSI suggests little chance of short-term gain.
Because its long-term fundamentals are unaltered, it is appealing during drops.
Action advised: Watch and wait
Hold off on making rash entries based just on price declines; instead, wait for technical confirmation.
⚠️ Note that this is not advice on investments. All opinions are solely intended for educational purposes. Before making any investing decisions, please speak with an advisor who is registered with SEBI.
📬 Keep an eye on NexGen Trade.
Follow us on social media or subscribe to our blog for additional information on equities shares, Indian stock market trends, and financial tools.

Leave a Reply