Technical Mastery for Winning Share Market Trades
Gain an edge in Trade, share market, and Investment with expert technical insights. Decode charts, trends & strategies to make smarter trading decisions.
The Significance of Technical Stock Analysis Prior to Purchasing Equity Shares in Indian Stock Market
However, it's as important to know when to buy or sell stocks. Technical analysis is useful in this situation.
We'll go over the importance of technical stock analysis, important indicators to employ, and how it fits into your overall investment plan in this blog article from NexGen Trade.
Technical analysis: what is it?
Rather, it makes the assumption that the stock price already takes into account all relevant information, including financial outcomes, predictions for the future, and even investor sentiment.
Traders and investors benefit from this analysis:
Recognize patterns and reversals
Points of entry and departure
Establish stop losses.
Recognize the mood of the market
Technical analysis gives you the advantage whether you're trading mid-cap momentum stocks or investing in blue-chip equities shares.
Why Do You Need Technical Analysis Before Investing?
1. Timing the Market Entry
You might have found a fundamentally strong stock, but entering at the wrong time can still lead to losses.
For example, even a good stock can dip during a market correction.
Technical analysis shows if the stock is currently overbought or oversold — helping you time your investment smartly.
2. Spotting Short-Term Opportunities
If you're doing swing or intraday trading, technical analysis is essential.
It helps identify short-term price patterns and momentum indicators that aren’t visible through fundamentals.
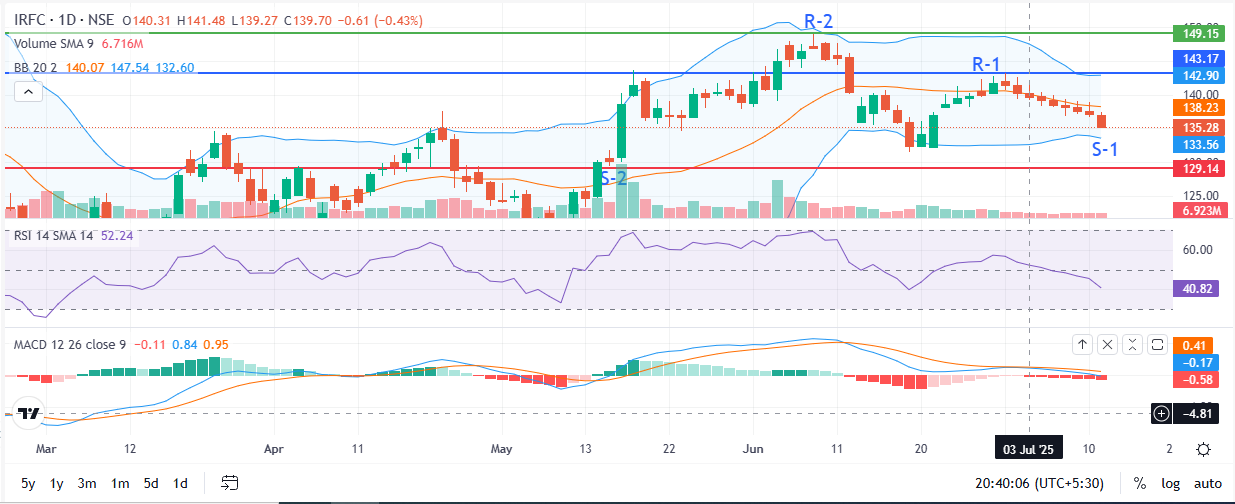
Using tools like candlestick patterns, support/resistance levels, and RSI, you can capture quick gains.
3. Risk Management with Stop Losses
Every smart finance strategy includes a way to manage risks.
With technical analysis, you can determine logical stop-loss levels.
This protects your capital if the market moves against you.
4. Recognizing Market Attitude
The thoughts of traders—fear, greed, and indecision—are reflected in technical indicators.
Price action is truthful. These movements, whether they are a bearish breakdown or a bullish breakout, show you how the market responds to events, news, or earnings.
Important Instruments and Measures for Technical Analysis
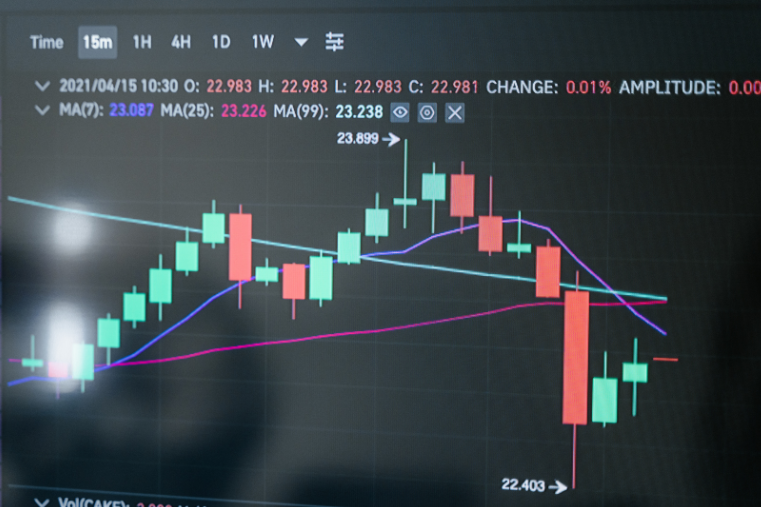
1. Charts of Candlesticks
The open, high, low, and close prices for a certain period are displayed in these charts.
Changes in market sentiment are indicated by patterns such as Doji, Hammer, and Engulfing.
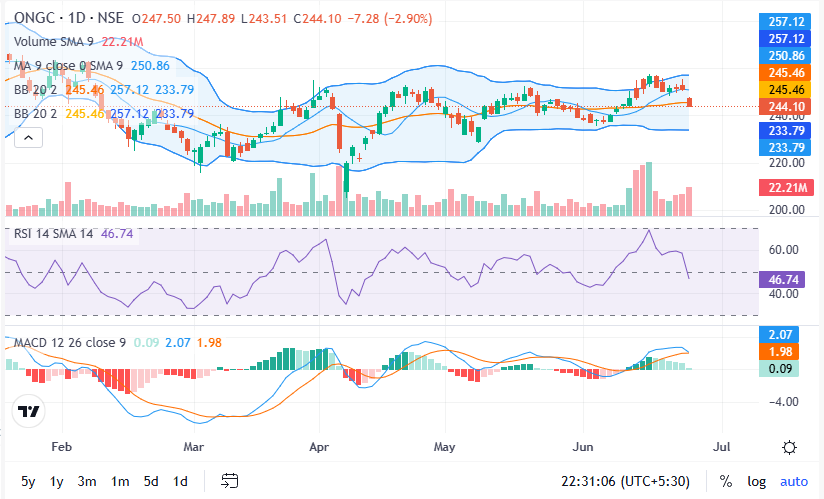
2. MAs, or moving averages
3. Momentum is measured by the Relative Strength Index (RSI).
RSI < 30 = Oversold
Excellent for identifying reversal zones before to investing in stocks.
4. Moving Average Convergence Divergence, or MACD
When two EMAs cross, it produces buy/sell signals.
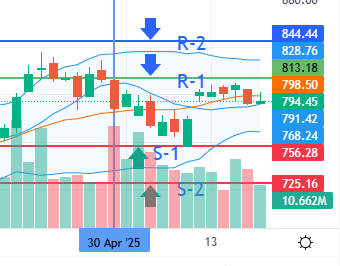
5. Assistance and Opposition
Using Indian Stock Market Technical Analysis Technical analysis enables you to respond swiftly in India, where market emotion, budget announcements, elections, and international cues all have a significant impact on stock prices.
Assume that a significant resistance level is broken by the Nifty 50 index. With the use of technical tools, you could find high-potential stock shares to follow the trend if this signals a larger advance.
Indian investors frequently use the following platforms:
Chartink
Kite Zerodha
The Upstox Pro
Smart Charts for Angel One
These tools make analysis simple for both novices and experts by providing interactive charts with integrated indicators.
Combining Fundamental and Technical Analysis
To decide when to buy or sell, use technical analysis.
Assume, for instance, that Infosys's revenue growth and minimal debt make it a wise long-term investment. Now, when the price breaks out over a long-term resistance level with high volume, you use technical analysis to purchase the stock. Your odds of success are increased by this tactic.
Technical Stock Analysis Dos and Don'ts
Test your plan in advance.
Learn the fundamental indications and patterns of charts.
Prior to going live, practice on demo accounts.
DON'T:
Overuse of indicators could result in contradictory indications.
Exchange feelings. Adhere to your stop-loss and setup.
Ignore the basics entirely.
Conclusion:
At NexGen Trade, we think that every wise investment choice should be supported by both market and financial expertise. Although it doesn't ensure earnings, technical analysis does increase your chances.