


In this Reliance Industries Stock Analysis, we’ll take a closer look at the company’s technical indicators, support and resistance levels, trading outlook, and current fundamentals to understand whether the momentum is set to continue.
Reliance Industries Limited (RIL) remains one of India’s most influential conglomerates, continuing to dominate the nation’s finance and investment landscape. As a heavyweight in both the Sensex and Nifty 50, the company’s equity shares are a top choice among institutional and retail investors alike. On August 19, 2025, a strong bullish candle formed on the charts, reigniting optimism among traders and long-term investors.
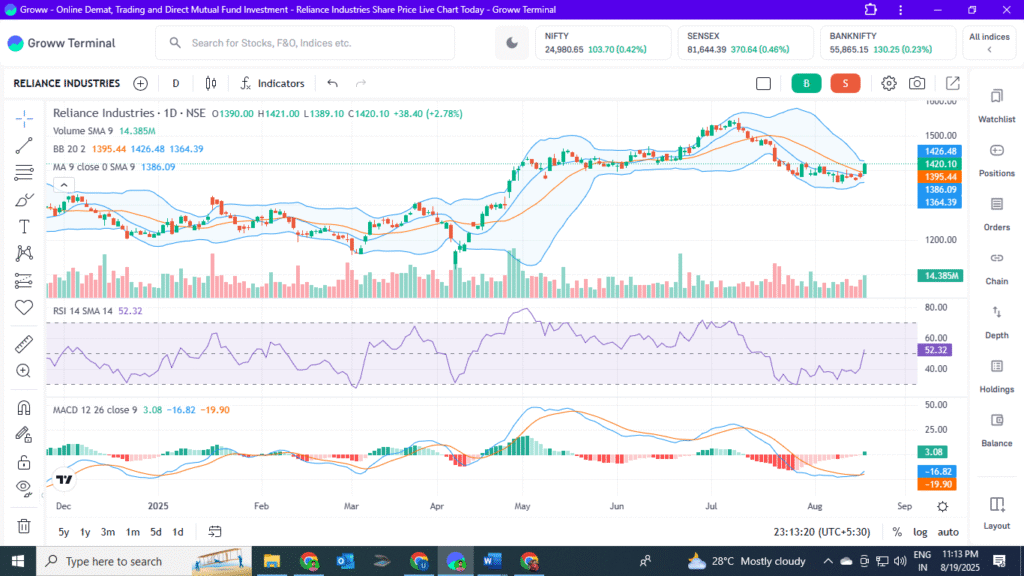
📊 Reliance Industries Stock Analysis of Market Snapshot
Previous High: ₹1551/-
Previous Low: ₹1365/-
Today’s Price Action:
Open: ₹1390.00/-
High: ₹1421.00/-
Low: ₹1389.10/-
Close: ₹1420.10/-
Candle Pattern: Bullish Candle
Trend: Still down from the previous high but showing recovery signs near earlier support.
The bullish candle after testing lower levels suggests a shift in sentiment toward buyers regaining control.
📈 Technical Indicator Analysis
1. RSI (Relative Strength Index) – 52.32
At 52.32, the RSI shows a neutral to slightly optimistic outlook. There is room for more upward momentum because the stock is neither overbought nor oversold.
2. MACD (Moving Average Convergence Divergence)
A bullish crossover occurred just now when the MACD line moved above the signal line from below. This points to growing momentum and the possibility of a brief upward trend.
3. Moving Average
As long as prices remain above the Simple Moving Average (SMA), the stock price’s current position above the SMA is a hint that bullish continuation is likely.
4. Bollinger Bands
Upper Band (Resistance): ₹1426.48
Middle Band (SMA): ₹1395.00
Lower Band (Support): ₹1364.00
The stock is testing resistance because it is near the upper band. Additional gains could be triggered by a breakout over this level.
🔍 Key Support and Resistance Levels
Immediate Resistance: ₹1426/-
Strong Resistance: ₹1450/- and ₹1485/-
Immediate Support: ₹1395/-
Major Support: ₹1365/-
The stock might be able to test ₹1450 in the near future if it makes a strong rise over ₹1426.
The critical ₹1365 zone will come after ₹1395, which will provide as immediate support on the downside.
📌 Recommendation – Purchase, Sell, or Wait?
The bullish candle and MACD crossover support a buying sentiment.
RSI at 52.32 shows room for upside.
Price trading above SMA confirms strength.
👉 Short-Term Traders: Can look for a buy opportunity on breakout above ₹1426, with potential targets of ₹1450 and ₹1485.
👉 Long-Term Investors: Given Reliance’s strong fundamentals, it is advisable to accumulate on dips near ₹1395–1365 for future wealth creation through equity shares.
👉 Caution: If the stock slips below ₹1365, bearish pressure may re-emerge.
Reliance Industries – Fundamentals as of 19th August 2025
The most significant and varied conglomerate in India is still Reliance Industries. It is a pillar of the Indian corporate and financial world due to its involvement in numerous areas.
Business Segments:
- Energy & Petrochemicals: The backbone of Reliance, contributing a large portion of revenue.
- Telecom & Digital Services (Jio): India’s leading telecom operator with continuous growth in data and digital platforms.
- Retail: Reliance Retail is the country’s largest retail business, covering groceries, fashion, electronics, and e-commerce.
- Renewable Energy Transition: Reliance is aggressively investing in green energy projects, including solar, battery storage, and green hydrogen, aligning with India’s sustainability goals.
Current Position – 2025
Reliance is one of the leading firms in India and has maintained a high market capitalization.
By growing Jio Financial Services, the firm is fortifying its digital finance ecosystem.
Both in urban and rural India, retail and e-commerce divisions are still gaining market share.
Reliance is now positioned as a player in the global energy market that is prepared for the future thanks to its investments in renewable energy.
Investors who own Reliance’s equity shares benefit from long-term stability thanks to these varied revenue sources.
📉 Risks to Monitor
Changes in the price of crude oil globally have an effect on refining margins.
fierce rivalry in the retail and telecom industries.issues with regulations in the financial, communications, and energy sectors.
Large-cap equities are impacted by broader market corrections.
📊 Outlook
Short-Term (1–2 Weeks): The stock could fluctuate between ₹1395 and ₹1450. Additional momentum could result from a breakout above ₹1450.
Medium to Long-Term (6–12 Months): Reliance is still a wise choice for long-term portfolios due to its diverse business operations, strong push in digital platforms, and renewable energy.
✅ Conclusion
The performance of Reliance Industries on August 19, 2025, shows a trend of recovery with a bullish candle, a positive MACD crossover, and prices that remain above the SMA. Investors should keep a close eye on the resistance level of ₹1426.
👉 Resistance Levels: ₹1426, ₹1450, ₹1485
👉 Support Levels: ₹1395, ₹1365
👉 Action: Long-term investors may accumulate on dips, while short-term traders may think about buying over ₹1426.
Because of its great technical strength and solid fundamentals, Reliance is still one of the best equity shares in India.
⚠️ Disclaimer: this is not advice on investments. The presented study is solely intended for informational and educational reasons. Before making any investing decisions, investors should either speak with a financial professional or do their own research.
Frequently Asked Questions (FAQs)
Q1. What is the current trend of Reliance Industries stock as of 19th August 2025?
As of 19th August 2025, Reliance Industries shows a bullish trend with a positive MACD crossover and RSI around 52, indicating potential upward momentum.
Q2. What are the key support and resistance levels for Reliance Industries stock?
Immediate support levels are ₹1395 and ₹1365, while resistance levels are ₹1426, ₹1450, and ₹1485.
Q3. Is Reliance Industries stock a good buy now?
For short-term traders, a breakout above ₹1426 may signal a buy opportunity. Long-term investors can accumulate on dips near ₹1395–1365, given Reliance’s strong fundamentals.
Q4. What does the RSI value of Reliance Industries indicate?
With an RSI of 52.32, the stock is neutral to mildly bullish — suggesting room for further upside.
Q5. What is the short-term outlook for Reliance Industries stock?
In the short term (1–2 weeks), the stock could range between ₹1395 and ₹1450. A breakout above ₹1450 may trigger further gains.
Q6. What are the major business segments of Reliance Industries?
Reliance operates in energy & petrochemicals, telecom (Jio), retail, and renewable energy — providing a strong, diversified business base.
Q7. What risks should investors watch before investing in Reliance Industries?
Key risks include global crude oil price fluctuations, competition in telecom and retail, and regulatory changes in the financial and energy sectors.