Unlock Fearless Trading Power: Master Hammer to Shooting Star
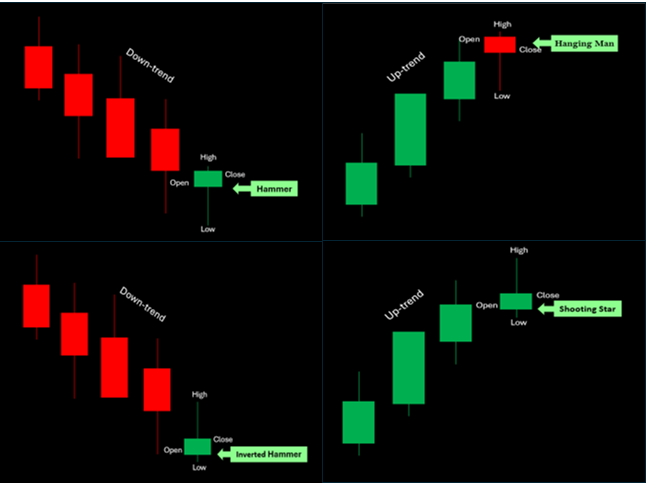
One of the most effective methods for examining price changes in the Indian stock market is to comprehend candlestick patterns. These patterns, which depict the interactions between buyers and sellers over a given period, visually represent market psychology. The Hammer, Hanging Man, Inverted Hammer, and Shooting Star are some of the most dependable single-candle reversal patterns.
We’ll look at how to trade with these candlestick patterns in this article, particularly when trading equity shares.
1. Candlestick Patterns’ Influence on Trading
Although they were first used by Japanese rice dealers centuries ago, candlestick patterns are now essential to contemporary investing and banking. The open, high, low, and close prices are the four key data points displayed by each candlestick, and they disclose hidden market emotions like uncertainty, anxiety, and greed.
Learning to understand these patterns can help you spot potential reversals, continuations, and trend exhaustion points, all of which are essential for improving your decision-making in the erratic Indian stock market.
2. What is the pattern of the Hammer Candlestick?
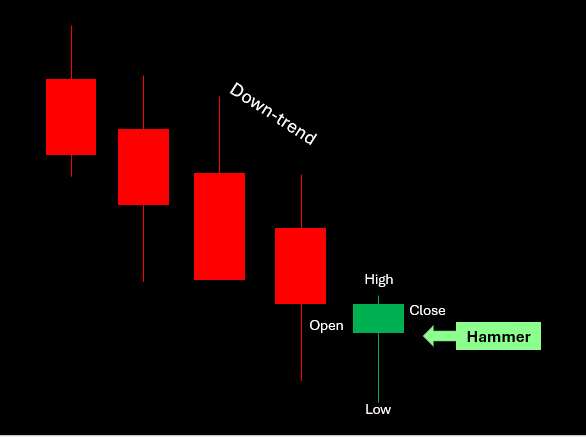
A possible bullish reversal is indicated by a hammer, which emerges at the bottom of a downward trend.
Its extended lower shadow, little to no upper shadow, and modest genuine body toward the top indicate that, despite sellers pushing prices lower, purchasers recovered control by the close.
How to Exchange the Hammer:
The following day, look for a bullish candle or increased volume to confirm the signal.
Put a purchase order above the high of the Hammer.
Maintain a stop-loss below the low of the candle.
For traders concentrating on equities shares that have just corrected but are showing indications of recovery, this setup frequently works effectively.
3. The Pattern of the Hanging Man
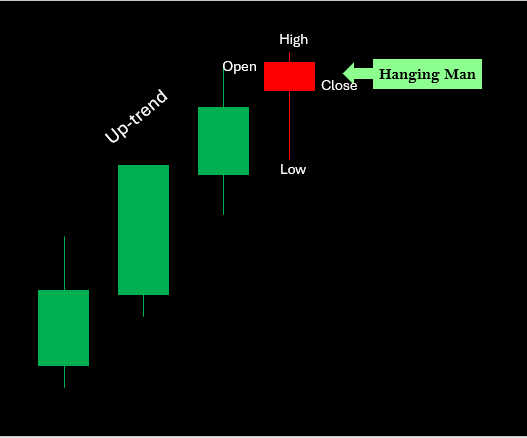
Despite having a similar appearance to the Hammer, the Hanging Man appears at the peak of an upward trend, suggesting a possible bearish reversal. It implies that selling pressure is starting to rise in spite of robust buying.
Trading the Hanging Man: A Guide
A red candle closing below the Hanging Man’s low will serve as confirmation.
Get out of your long trades or go short.
Set a stop-loss above the high of the candle.
When a stock has experienced a substantial increase, this pattern may serve as a warning to lock in profits in the realm of finance and investment.
4. The Inverted Hammer Pattern
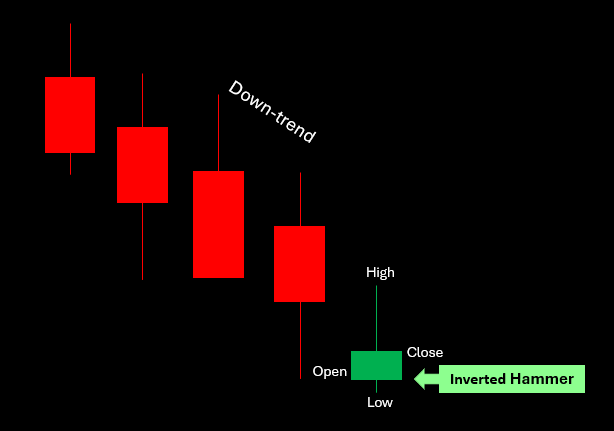
Following a downward trend, an inverted hammer appears, suggesting a potential bullish turnaround. It has little to no lower shadow, a long upper shadow, and a little genuine body. This indicates that although purchasers tried to drive prices higher but were unable to sustain their momentum, their efforts indicate that demand may be starting to recover.
Trading Plan:
After a protracted downward trend, watch for an Inverted Hammer.
A bullish candle closing above it serves as confirmation.
Maintain a stop-loss below the low and buy above the high.
When there is significant selling pressure followed by reversal attempts, this pattern frequently shows up in volatile equities shares.
5. The Pattern of Shooting Stars
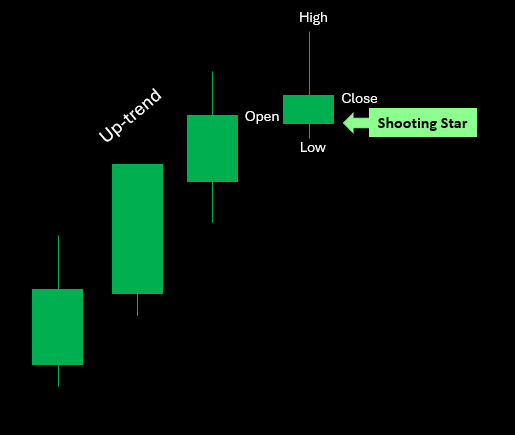
The Inverted Hammer’s bearish counterpart is the Shooting Star. It indicates possible selling pressure ahead and shows up at the peak of an upward trend.
Trading the Shooting Star: A Guide
A red candle shutting below the Shooting Star’s low will serve as confirmation the following day.
Around that level, start a short or sell position.
Keep your stop-loss just above the high.
To profit from trend reversals, a lot of Indian traders employ the Shooting Star in swing trading or short-term setups.
6. Useful Advice for Candlestick Pattern Trading
Despite their dependability, these patterns shouldn’t be applied alone. For more robust confirmation, combine them with trendlines, volume analysis, and technical indicators like moving averages or RSI.
Here are some expert pointers:
Steer clear of trading during periods of low volume or during significant news events.
Never risk more than 1% to 2% of your entire investment on a single deal; always practice sound risk management.
Before engaging in live trading, practice spotting these trends on historical charts.
To increase the dependability of stock shares, look for these patterns on daily or weekly charts.
Though they might increase your trading accuracy with dedication, keep in mind that no pattern ensures success.
7. Using Candlestick Patterns in Indian Stocks as an Example
Let’s look at Tata Motors as a hypothetical example:
Let’s say the daily chart displays a Hammer with increased volume near ₹650 after a downward trend. A reversal is confirmed when the candle closes above the Hammer’s high the next day.
With a stop-loss around ₹640, a trader might purchase at about ₹660 with a goal of ₹700–₹720.
In a similar vein, traders may expect a brief drop and modify their positions if Infosys displays a Shooting Star close to ₹1,750 following a robust surge.
These configurations demonstrate how traders can more efficiently plan their entrances and exits by using price action and candlestick psychology.
8. The Significance of Candlestick Patterns in the Indian Market
Global events, regional economic statistics, and investor sentiment all have an impact on the Indian stock market. Candlestick analysis provides traders with a visual and intuitive means of comprehending market psychology in such a dynamic environment.
These patterns serve as a compass, assisting you in identifying reversals early and safeguarding equity share gains, regardless of your level of experience with investing or your level of education in finance.
Conclusion
For traders in the Indian stock market, the Hammer, Hanging Man, Inverted Hammer, and Shooting Star candlestick patterns are crucial resources. They support effective risk management, entry point refinement, and the identification of possible market reversals.
But keep in mind that effective technical analysis requires both emotional restraint and good investment discipline. Profits are not guaranteed by a single indication, but rather by patience and perseverance.
Disclaimer
This isn’t advice on investments. The content presented here is solely intended for educational purposes. Before making any investing decisions, investors should either speak with a registered financial advisor or do their own research.


Leave a Reply