Analyzing market trends and technical indications is essential to developing a sound investment strategy. State Bank of India (SBI), one of the most traded banking companies in India, has seen a lot of price movement recently. To assist investors in making better selections, we will examine SBI's equity shares today using up-to-date market data and indicators.
SBI Stock Overview:
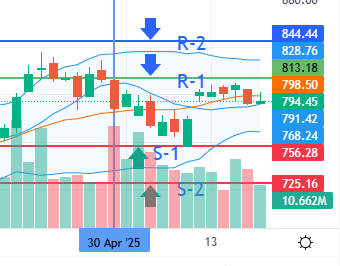
52-Week High: ₹912 Key Market Data52-Week Low: ₹680₹812.55 was the previous close.Available Now: ₹811.50Today's high: ₹811.50Today's Low: ₹784Today's Close: ₹788SBI formed a Long Black Line candle, a bearish indicator that points to possible negative trend, as it concluded today's session at ₹788, down from the previous closing.
Triple Top Chart Pattern Analysis
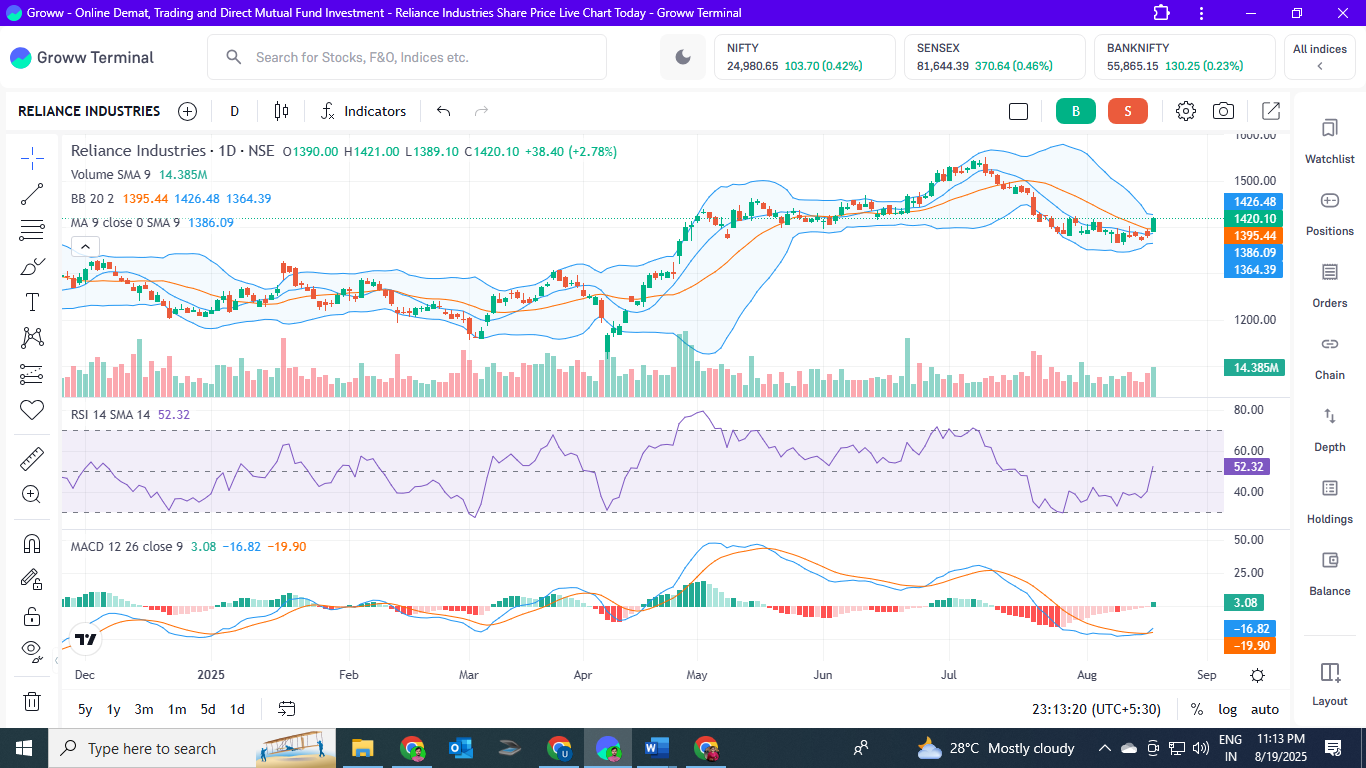
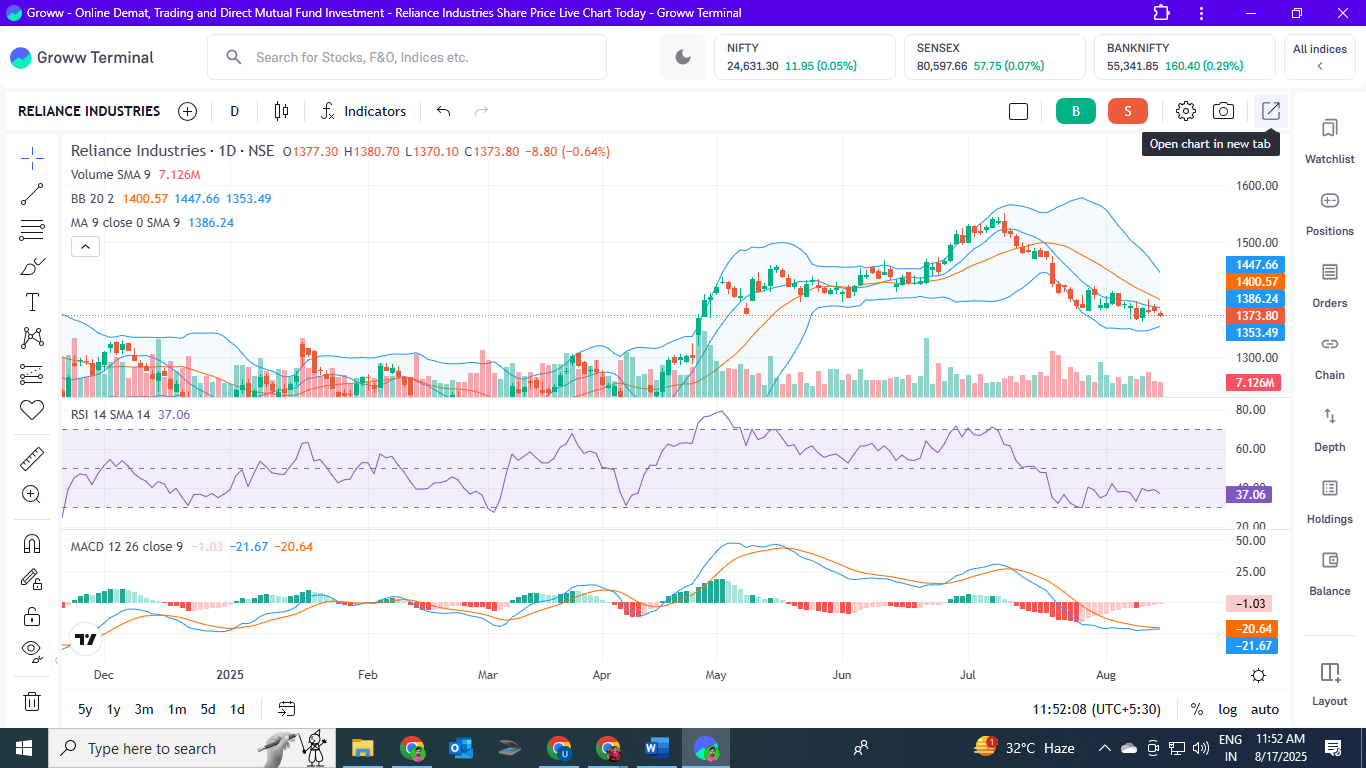
The Triple Top pattern, a bearish reversal structure, is visible on SBI's current chart. This pattern usually appears following an upward trend and indicates that the stock would find it difficult to overcome resistance and may see additional declines. Sellers are taking control since the price has failed to maintain its position above the resistance level of ₹812.
Breakdown of Technical Indicators
Let's examine a few important indications to comprehend SBI's short- and medium-term movement.
52.14 is the relative strength index (RSI).
With neither overbought nor oversold circumstances indicated, this reading is neutral. A decline toward 40–45, however, would indicate waning impetus.
MACD: Negative
The price trend may continue to decline, according to the MACD. Short-term investors are recommended to exercise caution.
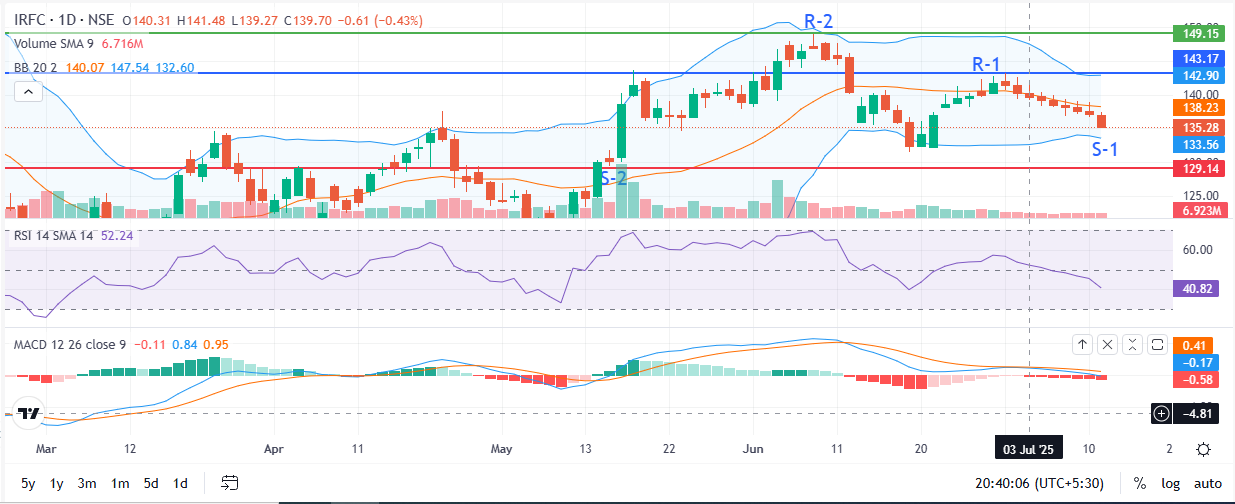
Levels of Support and Resistance
By determining the best times to enter and exit an investment, knowledge of support and resistance levels aids in plan refinement:Support 1: ₹760
Second Support: ₹730
First resistance: ₹812
Second resistance: ₹835
The stock may test the next support levels in the upcoming sessions, as evidenced by its failure to hold above the ₹812 resistance, as seen by today's closing at ₹788. The price may approach ₹730 if it drops below ₹760, providing long-term investors with possible purchasing opportunities.
💡 Suggested Investment Plan
The short-term forecast for SBI stock shares is bleak based on current patterns and indicators. Long-term growth potential is still possible, though, particularly for value investors looking for solid banking fundamentals.
Trading Tip: Before thinking about making a new entry, wait for confirmation close to the ₹760–₹730 support zone. This cautious strategy fits with the present downward trend while reducing risk.
If you have a long-term investment horizon, observing SBI's performance at its support levels may offer a better entry point. It is crucial for traders to have stop-losses in place and refrain from making rash entries close to resistance.
Conclusion
Long-term investors may profit from well-timed entries, while short-term volatility may discourage rapid trades. SBI is a pillar of the Indian financial system. The stock may soon trend lower, as indicated by the Triple Top, bearish MACD, and inability to maintain above resistance.
It is advised to wait before making a purchase. Before deciding to enter, keep an eye on the price activity around ₹760–₹730.
It is advised to wait before making a purchase. Before deciding to enter, keep an eye on the price activity around ₹760–₹730.
Disclaimer:
Note: this is not advice for investments. The content offered is solely intended for educational reasons. Before choosing an investment, please do your own research or speak with a qualified financial advisor.


Leave a Reply