Buying and selling stock shares within the same trading session, or intraday trading, is a fast-paced method that requires accuracy and sound judgment. Many traders rely on technical indicators to help them thrive in this highly volatile environment. These resources provide insightful information about market momentum, price movement, and possible reversal points.
This blog will discuss how to use some of the most popular technical indicators, such as the Moving Average Convergence (MACD) and the Relative Strength Index (RSI), to improve your intraday trading strategy.
The Significance of Technical Indicators in Intraday Trading
Timing, discipline, and data-driven decisions are key components of intraday trading; luck is not. Short-term traders mainly rely on technical analysis to forecast market behavior, even though fundamentals are important for long-term investing. Traders benefit from technical indicators:
Analyze market trends and momentum.
Determine whether the market is overbought or oversold.
Identify breakthrough or reversal signals
Make wiser choices about when to enter and leave.
When used appropriately, these technologies improve your financial and investment choices, particularly when you’re trading equities shares in a hurry.
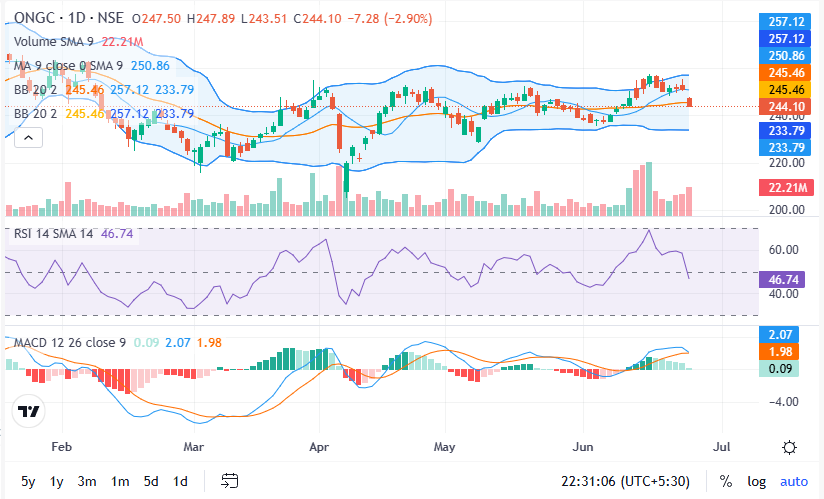
1.Identifying Overbought/Oversold Conditions with the Relative Strength Index (RSI)
What It Does: To assess whether a stock is overbought or oversold, RSI calculates the size of recent price movements. It has a range of 0 to 100.
Above 70: Overbought → Potential retreat or reversal
Below 30: Oversold → Potential rebound or upward rise
How to Trade Intraday Using RSI:
Entry Strategy: For a buy signal, wait for the RSI to fall below 30 before crossing back above it.
Exit Strategy: When the RSI crosses 70 and begins to decline, exit.
Pro Tip: To validate indications, combine RSI with candlestick patterns (such as engulfing or hammer).
2. Trend & Momentum with MACD (Moving Average Convergence Divergence)
What It Does: By comparing a signal line (9-day EMA) and two moving averages (usually 12-day and 26-day EMAs), MACD detects shifts in momentum.
Important Elements:
The MACD Line
The Signal Line
A histogram
Crossovers of the MACD:
When the MACD crosses above the signal line, it indicates a bullish crossover.
Sell when the MACD crosses below the signal line, indicating a bearish crossover.
How to Trade Intraday Using MACD:
Pay attention to price action divergences and zero line crosses.
In volatile markets, check with volume or RSI to prevent false signals.
3. Institutional Benchmark: VWAP (Volume Weighted Average Price)
What It Does: VWAP uses both price and volume to determine the average price at which a stock has traded during the day. It serves as a level of dynamic support and resistance.
How VWAP Is Used:
Price above VWAP indicates a bullish tendency; think about taking long positions.
Bearish tilt; take into consideration short positions if the price is below VWAP.
Intraday Approach:
When the price returns to VWAP in the trend’s direction, enter trades.
VWAP can be used as a re-entry point or trailing stop.
4. Bollinger Bands: Reversal Zones & Volatility
What It Does: A moving average with upper and lower bands set at standard deviations from the mean makes up a Bollinger Band.
When the price hits the upper band, it is overbought and may be a sell.
Price reaches a lower band: Oversold → Possible purchase
How to Apply Intraday Bollinger Bands:
During range-bound sessions, switch bands.
For impending breakout moves, keep an eye out for band squeezes, or the narrowing of bands.
5. Stochastic Oscillator: An Understanding of Short-Term Reversals
What It Does: The stochastic evaluates a stock’s closing price in relation to its range of prices over a given time frame, usually 14 days.
Overbought: Over 80
Under 20: Oversold
Use Within the Day:
When the lines representing %K and %D cross below 80 → Sell
When they surpass 20 → Purchase
Reversals can be more reliably confirmed and low-quality signals filtered out by combining the stochastic with RSI.
Combining Indicators to Increase Precision
You can increase your success rate by using a confluence of signals instead of depending only on one. This is a typical method:
Trend Verification: VWAP or MACD
Timing of Entry: Stochastic or RSI
Bollinger Bands as a Volatility Gauge
Volume Support: To verify the move’s power, use volume bars or OBV (On-Balance Volume).
There is no negotiating risk management.
Not even the most accurate indications are perfect. Constantly:
Employ stop-losses.
Limit the size of the position
Don’t overtrade.
To improve your strategy, keep a trading journal.
Concluding remarks
Gaining proficiency with technical indicators such as the Bollinger Bands, VWAP, MACD, and RSI can help intraday traders time their entries and exits more strategically. In addition to improving your ability to read charts, these tools help you make better financial and investment choices in the erratic world of equities shares.
But keep in mind that indications are only tools, not assurances. Because markets are dynamic and impacted by a wide range of factors, including sentiment, news, and macro data, it is important to use indicators appropriately while managing risk.
Disclaimer:
This blog is not intended to be financial advice; rather, it is meant to be instructive and informative. There are risks associated with stock market investment, therefore before making any decisions, readers should conduct independent research or speak with a licensed financial counselor. These are the author’s thoughts and may not represent those of NexGen Trade or its affiliates.


drover sointeru
Absolutely indited articles, thanks for selective information. “The earth was made round so we would not see too far down the road.” by Karen Blixen.